Your Profit and Loss Statement Is Trying to Tell You Something
Every month, your accounting software generates a report called a Profit and Loss statement. It might also be called an Income Statement or a Statement of Operations. Whatever your software calls it, it is the single most important financial document your business produces. It tells you whether you are making money, where that money is coming from, where it is going, and whether the pattern of your revenue and expenses is healthy or headed toward a problem.
The problem is that most business owners never actually read it. They glance at the bottom line, see a positive number, and move on. Or they see a negative number, feel a wave of dread, and close the tab. Neither response uses the report the way it was designed to be used. A Profit and Loss statement is not a verdict. It is a diagnostic tool. Reading it correctly tells you what to change, what to protect, and what to investigate before it becomes a crisis. This guide walks you through every section of the statement in plain English so you can read it with confidence, even if you have never taken an accounting class in your life.
What a Profit and Loss Statement Actually Is
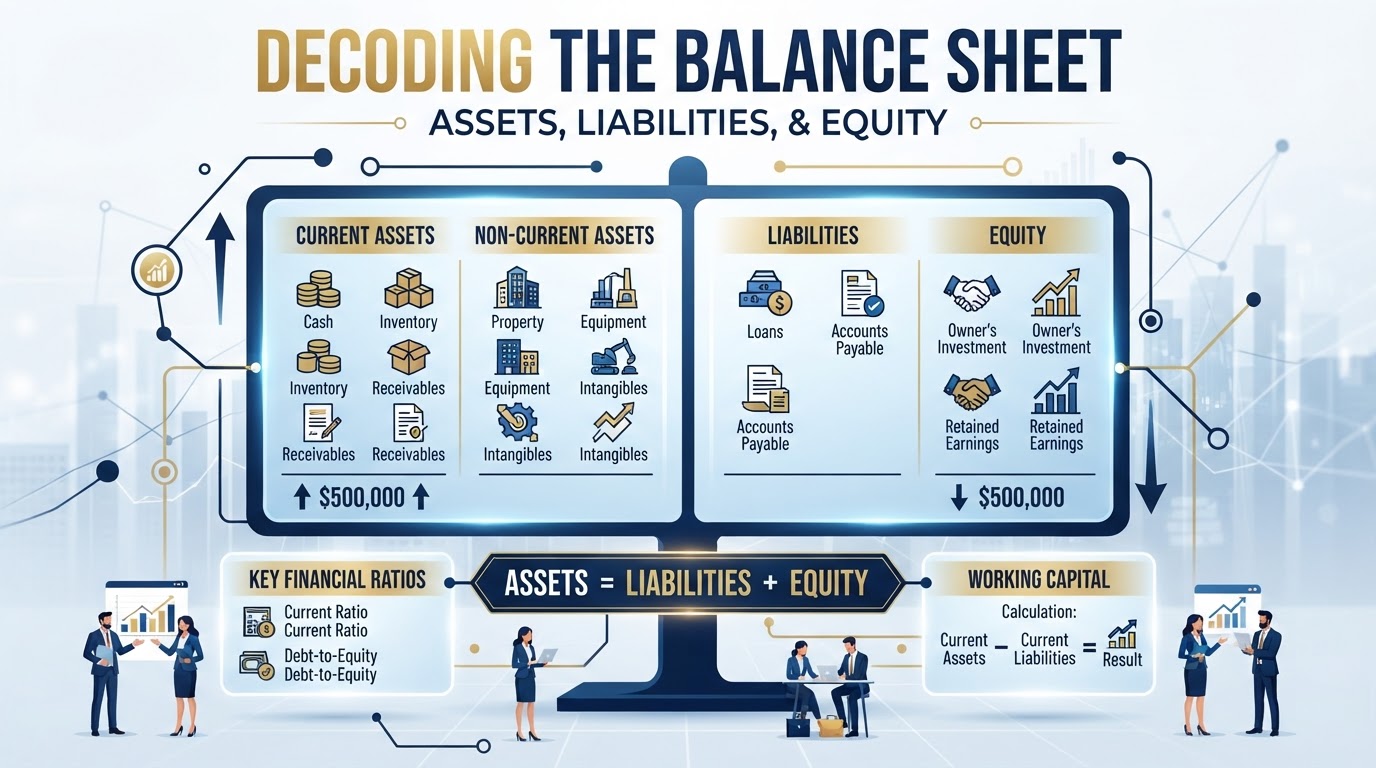
A Profit and Loss statement is a summary of your business activity over a specific period of time. That period could be a month, a quarter, a year, or any custom range you choose. Unlike a balance sheet, which is a snapshot of what you own and what you owe at a single moment, a Profit and Loss statement covers a span of time. It asks one fundamental question: during this period, did the business bring in more money than it spent?
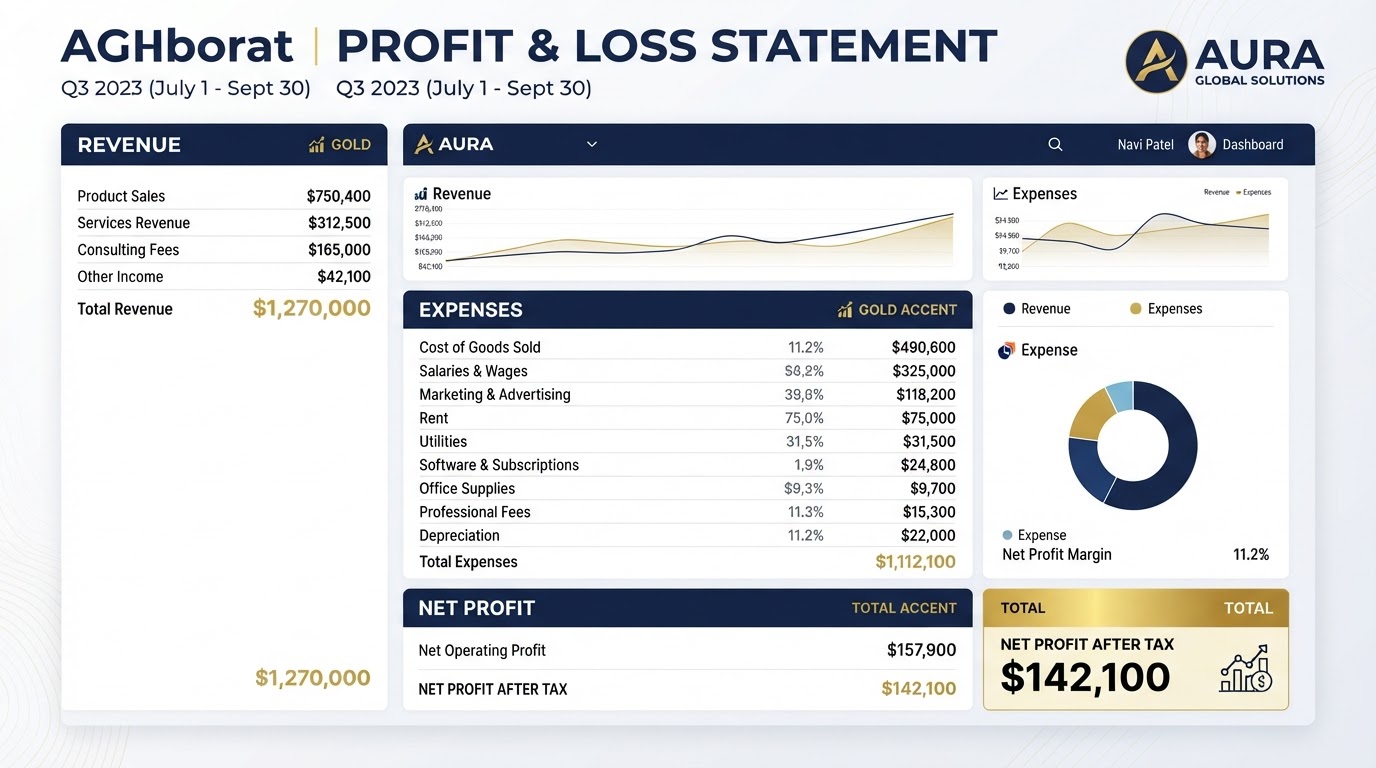
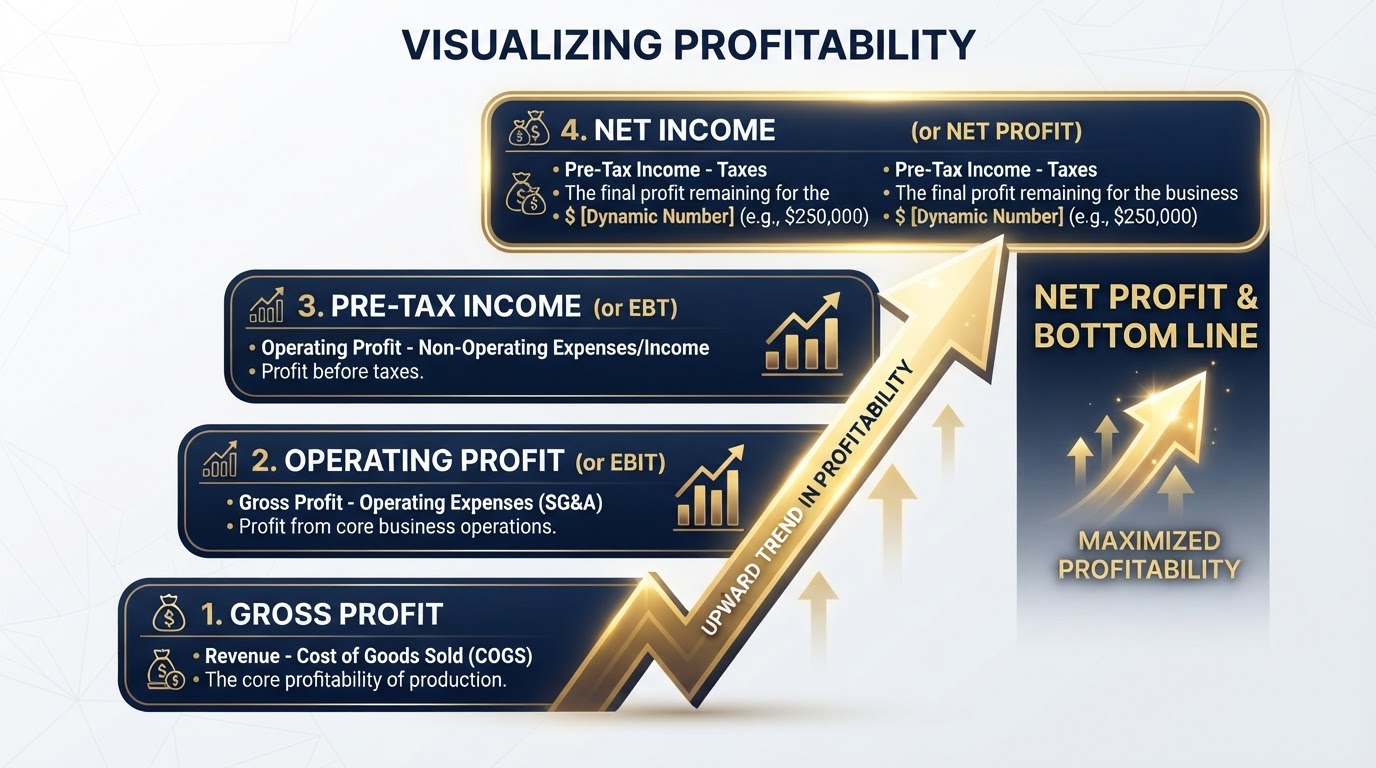
The statement is built on a simple formula. Revenue minus cost of goods sold equals gross profit. Gross profit minus operating expenses equals operating income. Operating income minus other income and expenses (things like interest, taxes, and one time items) equals net income, which is the famous bottom line. Every number on the statement feeds into this chain, and understanding how each piece flows into the next is the key to reading the report instead of just looking at it.
The reason so many owners struggle with the Profit and Loss statement is that it is packed with accounting terminology that was never designed for a non accountant audience. Terms like cost of goods sold, operating expenses, accrued revenue, and depreciation are thrown around as if everyone already knows what they mean. The truth is that each of these terms represents a real, understandable concept, and once you know what they are pointing at, the entire statement becomes readable.
Revenue: The Top Line and What It Really Tells You
Revenue is the first number on the statement, which is why it is called the top line. It represents the total amount of money your business brought in from selling its products or services during the period. If you run a service business, revenue is the total of all the invoices you sent out during the period. If you sell products, revenue is the total of all sales before any costs are subtracted.
The first thing to look at with revenue is whether it matches what you expect. If you had a busy month and the revenue number looks low, something is missing from the books. If the number looks surprisingly high, you may have recorded a deposit that was actually a loan or a transfer rather than true revenue. Revenue that does not match the reality of your business activity is the first sign that the books need attention.
The second thing to look at is the trend. A single month of revenue tells you very little. Three months in a row, compared to the same period last year, tells you whether you are growing, stagnating, or shrinking. If your revenue is climbing but your profit is not, your costs are growing faster than your income, and that is a pattern you need to catch early. If your revenue is flat, you may need to look at pricing, marketing, or customer retention. The top line is not the whole story, but it is the starting point for the story.

Cost of Goods Sold: What It Costs You to Produce Revenue
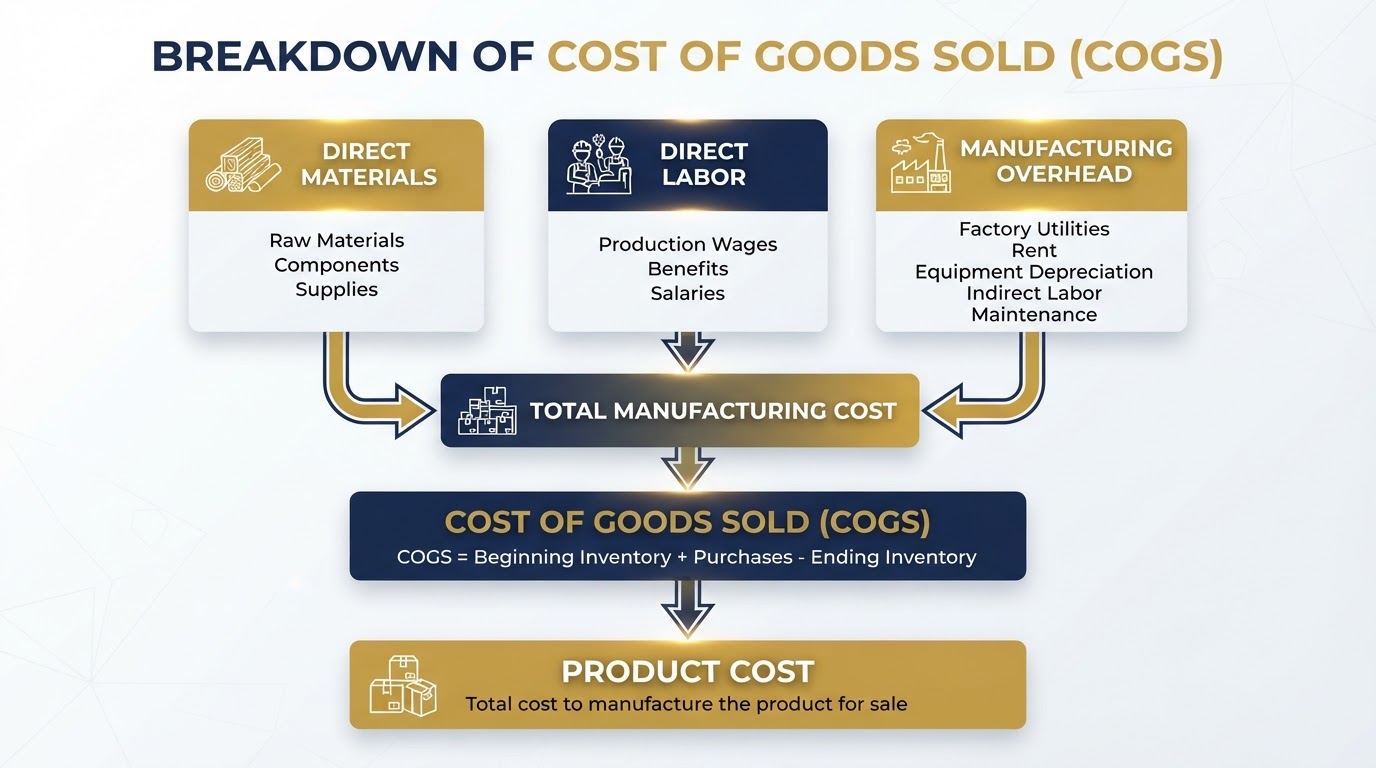
Cost of goods sold, often abbreviated as COGS, is the direct cost of producing the products or delivering the services that generated your revenue. For a manufacturer, this includes raw materials and direct labor. For a retailer, it is the wholesale cost of the products you resell. For a service business, it includes the wages of the people who directly deliver the service and any materials consumed in delivering it. COGS is not the same as operating expenses, and mixing the two up is one of the most common and damaging bookkeeping mistakes.
The reason the distinction matters is that COGS is directly tied to revenue. If you sell more, your COGS should go up. If you sell less, your COGS should go down. Operating expenses like rent and insurance, on the other hand, stay relatively fixed regardless of how much you sell. When COGS and operating expenses are mixed together, you lose the ability to see your gross margin, which is one of the most important indicators of business health.
Gross profit is revenue minus COGS, and gross margin is gross profit divided by revenue, expressed as a percentage. If your revenue is 100,000 dollars and your COGS is 60,000 dollars, your gross profit is 40,000 dollars and your gross margin is 40 percent. That 40 percent is the portion of every dollar of revenue that is available to cover your operating expenses and leave a profit. If your gross margin is shrinking over time, it means your production costs are rising faster than your prices, and that squeeze will eventually reach your bottom line if you do not address it.
Operating Expenses: The Costs of Running the Business
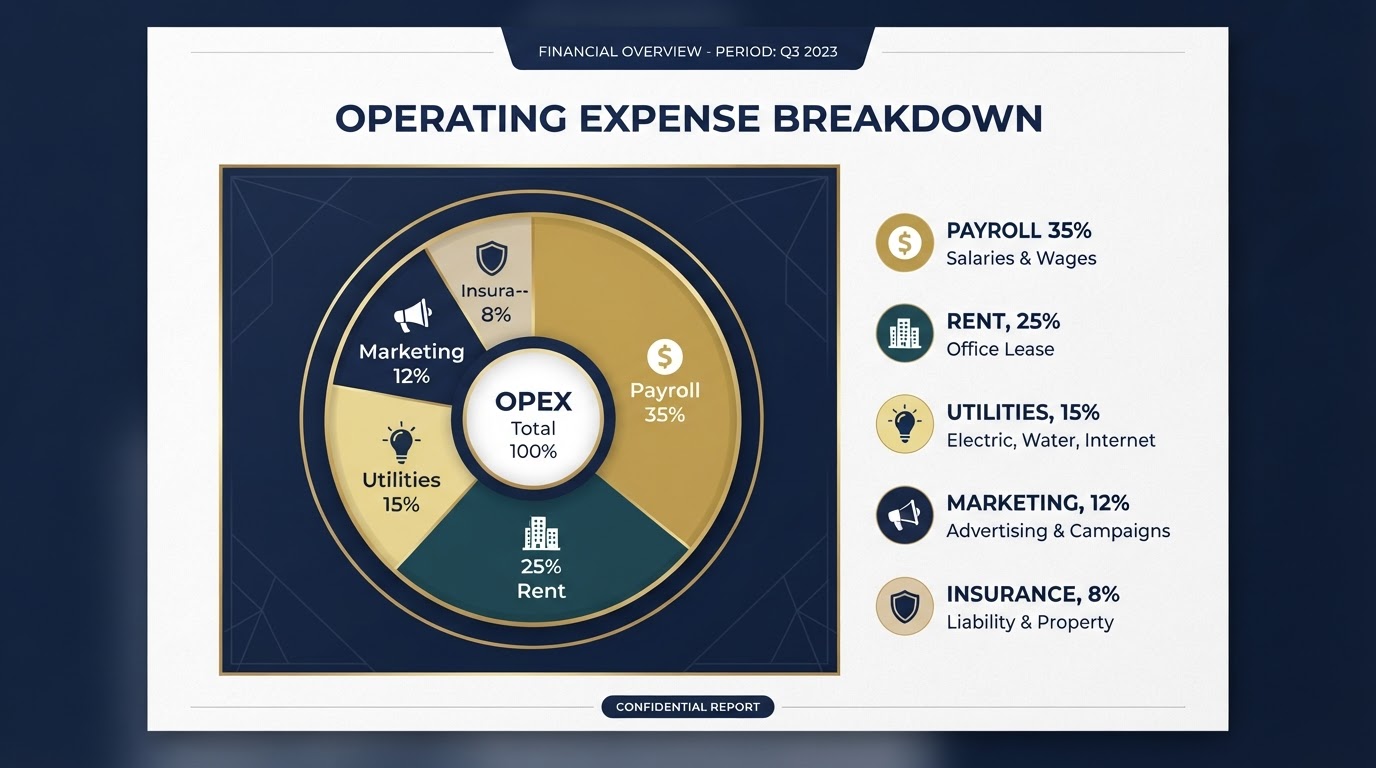
Operating expenses, often abbreviated as OPEX, are the costs of running the business itself, separate from the direct costs of producing what you sell. Rent, utilities, insurance, office supplies, software subscriptions, marketing, advertising, professional fees, and the wages of administrative staff all fall into this category. These are the expenses you would incur even if your revenue dropped to zero, because they are the cost of keeping the doors open.
When you read the operating expenses section, the first thing to look for is consistency. If your rent is normally 4,000 dollars a month and suddenly it shows 12,000 dollars, either you moved, or there is a categorization error. If your payroll expense jumps dramatically, either you hired people or a bonus was recorded in the wrong month. Operating expenses should follow a predictable pattern, and any line that breaks the pattern deserves a second look.
The second thing to look for is the ratio of operating expenses to revenue. If your operating expenses consume 60 percent of your revenue and your gross margin is 40 percent, you are barely breaking even. If your operating expenses consume 30 percent of your revenue and your gross margin is 40 percent, you have a healthy 10 percent operating margin. The relationship between these two numbers is more important than the absolute size of any single expense line.
A common mistake owners make is treating every expense as a problem to be cut. Not all expenses are created equal. Marketing that generates a return is an investment, not a cost. Training that improves productivity pays for itself. Software that saves time reduces labor costs elsewhere. The goal is not to minimize expenses but to optimize them, and you can only do that if your expenses are categorized clearly enough to see what each one is actually doing for the business.
Gross Profit and Gross Margin: The Number Most Owners Ignore
Gross profit is the amount of money left over after you subtract the direct cost of producing your product or service from your revenue. It is the number that tells you whether your pricing is sustainable. If your gross profit is positive but thin, you are surviving but not thriving, and any increase in costs will push you into a loss. If your gross profit is healthy, you have room to absorb the normal ups and downs of business without panicking.
Gross margin is gross profit expressed as a percentage of revenue, and it is the single best indicator of pricing health. A business with a 50 percent gross margin has twice the cushion of a business with a 25 percent gross margin, even if both are the same size. Tracking your gross margin over time tells you whether your pricing is keeping up with your costs. If your margin is declining, it means your costs are rising faster than your prices, and you need to either raise prices, negotiate better supplier terms, or find efficiencies in your production process.
The mistake most owners make is comparing their gross margin to a generic industry average without understanding what drives it. A consulting firm might have a 90 percent gross margin because its only direct cost is the consultant time. A grocery store might have a 25 percent gross margin because food has thin margins. The right comparison is not to an industry average but to your own history. Is your margin improving, stable, or eroding? That trend is what matters.
Operating Income: The Real Measure of Business Performance
Operating income is what is left after you subtract operating expenses from gross profit. It is the number that tells you whether the core business, the actual activity of producing and selling, is profitable. It excludes interest, taxes, and one time items because those are not part of the day to day operation of the business. Operating income is the cleanest measure of whether your business model works.
If your operating income is positive, your core business is generating more money than it consumes. If it is negative, your core business is losing money every period, and no amount of tax planning or one time gains will fix that. A business with negative operating income is a business that needs a structural change, not a tax deduction.
The reason operating income matters more than net income for management purposes is that net income includes items that are outside your control. A change in interest rates affects your interest expense. A change in tax law affects your tax provision. A gain or loss from selling an asset affects your bottom line but says nothing about whether your business is well run. Operating income filters all of that out and shows you the performance of the business itself.
Net Income: The Bottom Line and What It Actually Means
Net income is the final number on the statement, which is why it is called the bottom line. It is what remains after every cost, every expense, every interest payment, and every tax has been subtracted from your revenue. If the number is positive, the business made money during the period. If the number is negative, the business lost money. It is the number that owners focus on, and it is the number that determines whether there is money available to reinvest, distribute, or save.
The danger of focusing only on net income is that it can hide problems that the other sections reveal. A business can have positive net income because of a one time gain from selling an asset, while its core operations are losing money. A business can have negative net income because of a large tax provision, while its operations are healthy. The bottom line tells you the final result, but it does not tell you why that result happened. To understand the why, you have to read the rest of the statement.
Net income also flows directly into your balance sheet as retained earnings. When the business makes a profit, that profit either stays in the business as retained earnings or is distributed to the owners as distributions. When the business loses money, retained earnings decrease. This connection between the Profit and Loss statement and the balance sheet is why the two reports are read together, not in isolation.
Other Income and Expenses: The Section That Confuses Everyone
Below operating income, most Profit and Loss statements include a section called Other Income and Expenses. This is where items that are not part of your core operations live. Interest income from bank accounts, interest expense on loans, gains or losses from selling equipment, and one time items like an insurance settlement all belong here. The purpose of this section is to separate the results of your core business from the effects of financing, investing, and unusual events.
The mistake many owners make is recording transactions in this section that should be in operating expenses, or vice versa. Loan principal payments are not an expense at all, they are a balance sheet transaction, but owners often record them as an expense because the money left the bank account. Interest is the expense, not the principal. Similarly, owner distributions are not an expense, they are a reduction of equity, but they frequently end up on the Profit and Loss statement as an expense line. These errors distort both operating income and net income.
When you read this section, look for items that do not belong. If you see a large number in Other Income that does not match a real non operating event, it may be revenue that was misclassified. If you see a large expense in this section that looks like a recurring cost, it may be an operating expense that was miscategorized. Keeping this section clean ensures that your operating income reflects your true business performance and your net income reflects your true bottom line.
Common Mistakes That Make Your Profit and Loss Unreadable
The most common mistake is mixing personal and business transactions. When personal expenses flow through the business accounts, they end up on the Profit and Loss statement as expenses, which understates your true profit and creates tax problems. When business revenue is deposited into personal accounts, it never makes it onto the statement at all, which means your reported revenue is lower than your actual revenue. Both errors distort the statement and make it useless for decision making.
Another common mistake is using too many or too few accounts in the chart of accounts. If every expense is dumped into a single account called General Expenses, you cannot see what you are spending money on, and you cannot identify waste. If every tiny vendor gets its own account, the statement becomes so long that no one reads it. The right balance is enough accounts to see the major categories of spending clearly, without so many that the statement becomes a wall of numbers.
A third mistake is failing to reconcile the books before generating the Profit and Loss statement. If your bank accounts and credit cards are not reconciled to the statements, the numbers on the Profit and Loss may be missing transactions, duplicating transactions, or reflecting errors that have not been caught. A Profit and Loss statement generated from unreconciled books is not a reliable document, and making decisions based on it is no better than guessing.
How to Read a Profit and Loss Statement in Five Minutes
Start with revenue. Is it higher or lower than last month? Higher or lower than the same month last year? If there is a significant change, do you know why? A drop in revenue might be seasonal, or it might be a sign of lost customers. An increase might be growth, or it might be a one time project that will not repeat. Understanding the story behind the top line is the first step.
Next, look at gross margin. Is it consistent with prior months? If it has changed significantly, something has shifted in either your pricing or your production costs. A declining gross margin is a warning sign that should be investigated before it eats into your operating income. An improving gross margin is worth understanding so you can reinforce whatever caused it.
Then, scan the operating expenses for any line that looks unusual. Large swings in any expense category should be explainable. If you cannot explain a swing, it may be a categorization error or a missing receipt. The goal is not to memorize every number but to develop a feel for what normal looks like so that abnormal jumps out at you immediately.
Finally, look at operating income and net income. If operating income is positive but net income is negative, the problem is in the other income and expenses section, not in your core business. If both are positive and growing, the business is healthy. If both are negative, the business is losing money, and the statement will tell you whether the problem is revenue, gross margin, or operating expenses. That diagnosis is the value of reading the statement instead of just glancing at the bottom line.

A FIG Engagement: Making the Profit and Loss Statement Useful Again
A residential remodeling company came to Fiscal Integrity Group with a Profit and Loss statement they had been ignoring for years. The owner understood revenue and the bottom line but had no idea what gross margin meant, could not explain why some months showed a profit and others showed a loss, and had never used the statement to make a single business decision. The books were technically reconciled, but the chart of accounts was a mess, with most expenses dumped into a single account called Job Costs and a second account called Miscellaneous.
FIG restructured the chart of accounts to separate direct job costs from operating overhead. We split Job Costs into materials, subcontractor labor, direct labor, and permits. We split Miscellaneous into its actual components, which turned out to include office rent, software, insurance, and a subscription the owner had forgotten about. We set up classes so the owner could see profitability by job type, not just in aggregate. And we walked the owner through the statement section by section so they understood what each number represented and how the numbers connected.
Within two months, the owner was using the statement to make real decisions. They discovered that kitchen remodels had a gross margin of 42 percent while bathroom remodels were at 28 percent, and they shifted their marketing toward the more profitable service. They found that a particular subcontractor was costing 15 percent more than comparable subcontractors for the same quality of work, and they renegotiated or replaced that relationship. They identified the forgotten subscription and canceled it. The statement had been there all along. What changed was that it was finally readable, and the owner finally knew how to read it.
How Fiscal Integrity Group Helps You Read Your Numbers With Confidence
A Profit and Loss statement is only useful if it is accurate, organized, and understood. If your books are unreconciled, your chart of accounts is a mess, or your expenses are all dumped into catch all accounts, the statement cannot do its job. Fiscal Integrity Group cleans up your books, restructures your chart of accounts around your actual business, and walks you through your financials so you understand what every number means and how to use it.
We do not just hand you a report and walk away. We sit with you, explain the story your numbers are telling, and help you spot the patterns that matter. Whether your gross margin is eroding, your operating expenses are creeping up, or your revenue is flat and you cannot figure out why, the answer is in your Profit and Loss statement. We make sure you can actually read it, and we make sure the numbers on it are numbers you can trust.
Quick Tax Savings Estimator
See how much you could potentially save with proactive tax strategy and clean bookkeeping. Most LA businesses overpay by 15-20% simply due to missed deductions.
Free IRS Audit Risk Assessment
Do you mix personal and business expenses in the same bank account?
Frequently Asked Questions
How far back can you catch errors?
I perform a deep forensic review of your history to catch errors and fix them. Whether it's one year or five, my goal is to ensure your historical data is pristine before we move forward.
Will you educate me on how to manage my books?
Yes! My approach is highly educational. I want you to understand the "why" behind the numbers so you can make better business decisions with confidence.

About the Author
Wiyao Awesso
Wiyao Awesso is a leading financial advisor in Los Angeles. With extensive experience in tax strategy, accounting, and fractional CFO services, he helps business owners optimize their finances, minimize tax liabilities, and scale with confidence.